5.5.3.5. Adjust, Mock & Apply
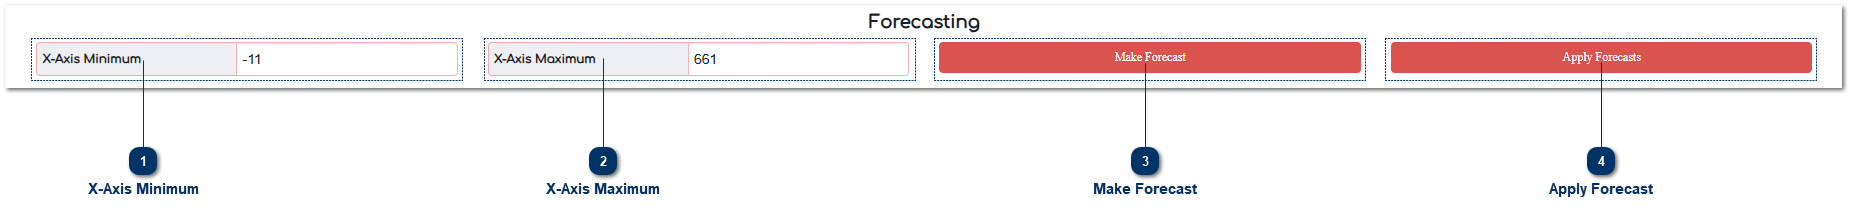
 X-Axis MinimumIndicates the viewing range of the Graph View.
|
|
 X-Axis MaximumIndicates the viewing range of the Graph View.
|
|
 Make ForecastCreate a mock forecast by entering the relevant sizes.
|
|
 Apply ForecastApply the regression calculation to all properties in the specified zone.
|
|