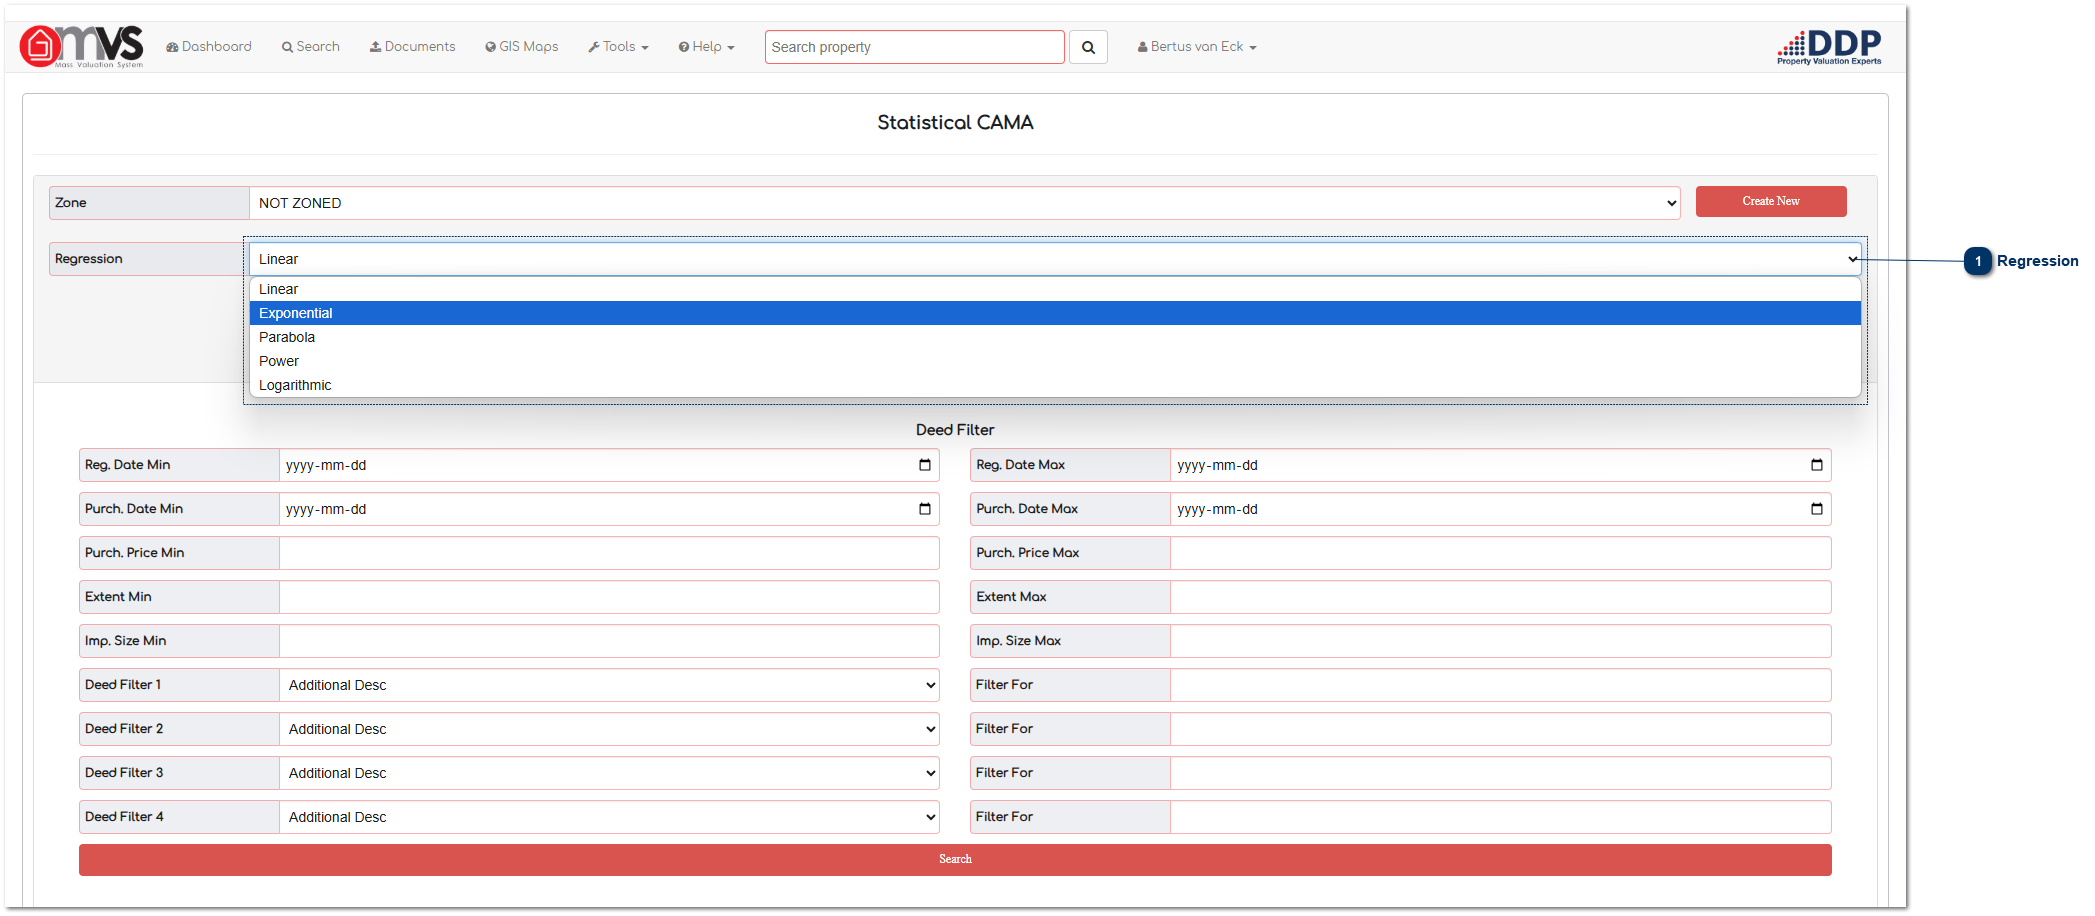
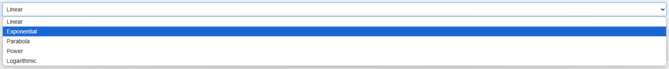
Select the relevant Regression calculation that will be utilised in the Zone.
Linear
Shape: A straight line with a constant slope.
Usage: Best for data that shows a steady, constant rate of increase or decrease.
Parabola
Shape: A parabola (U-shaped curve), which can open either upward or downward depending on the sign of a.
Usage: A 2nd-degree polynomial trendline models relationships where the rate of change is not constant but accelerates or decelerates over time. The model will also have a turning point that displays the peak.
Power
Shape: The power trendline curves either upward or downward depending on the exponent (b), and it fits data that can be described by proportional relationships.
Usage: Used when data increases at a certain power of x. It shows how one quantity changes in proportion to another at a constant rate.
Logarithmic
Shape: The logarithmic trendline increases or decreases rapidly at first, then levels off.
Usage: Best for data that increases or decreases quickly, but then slows down.