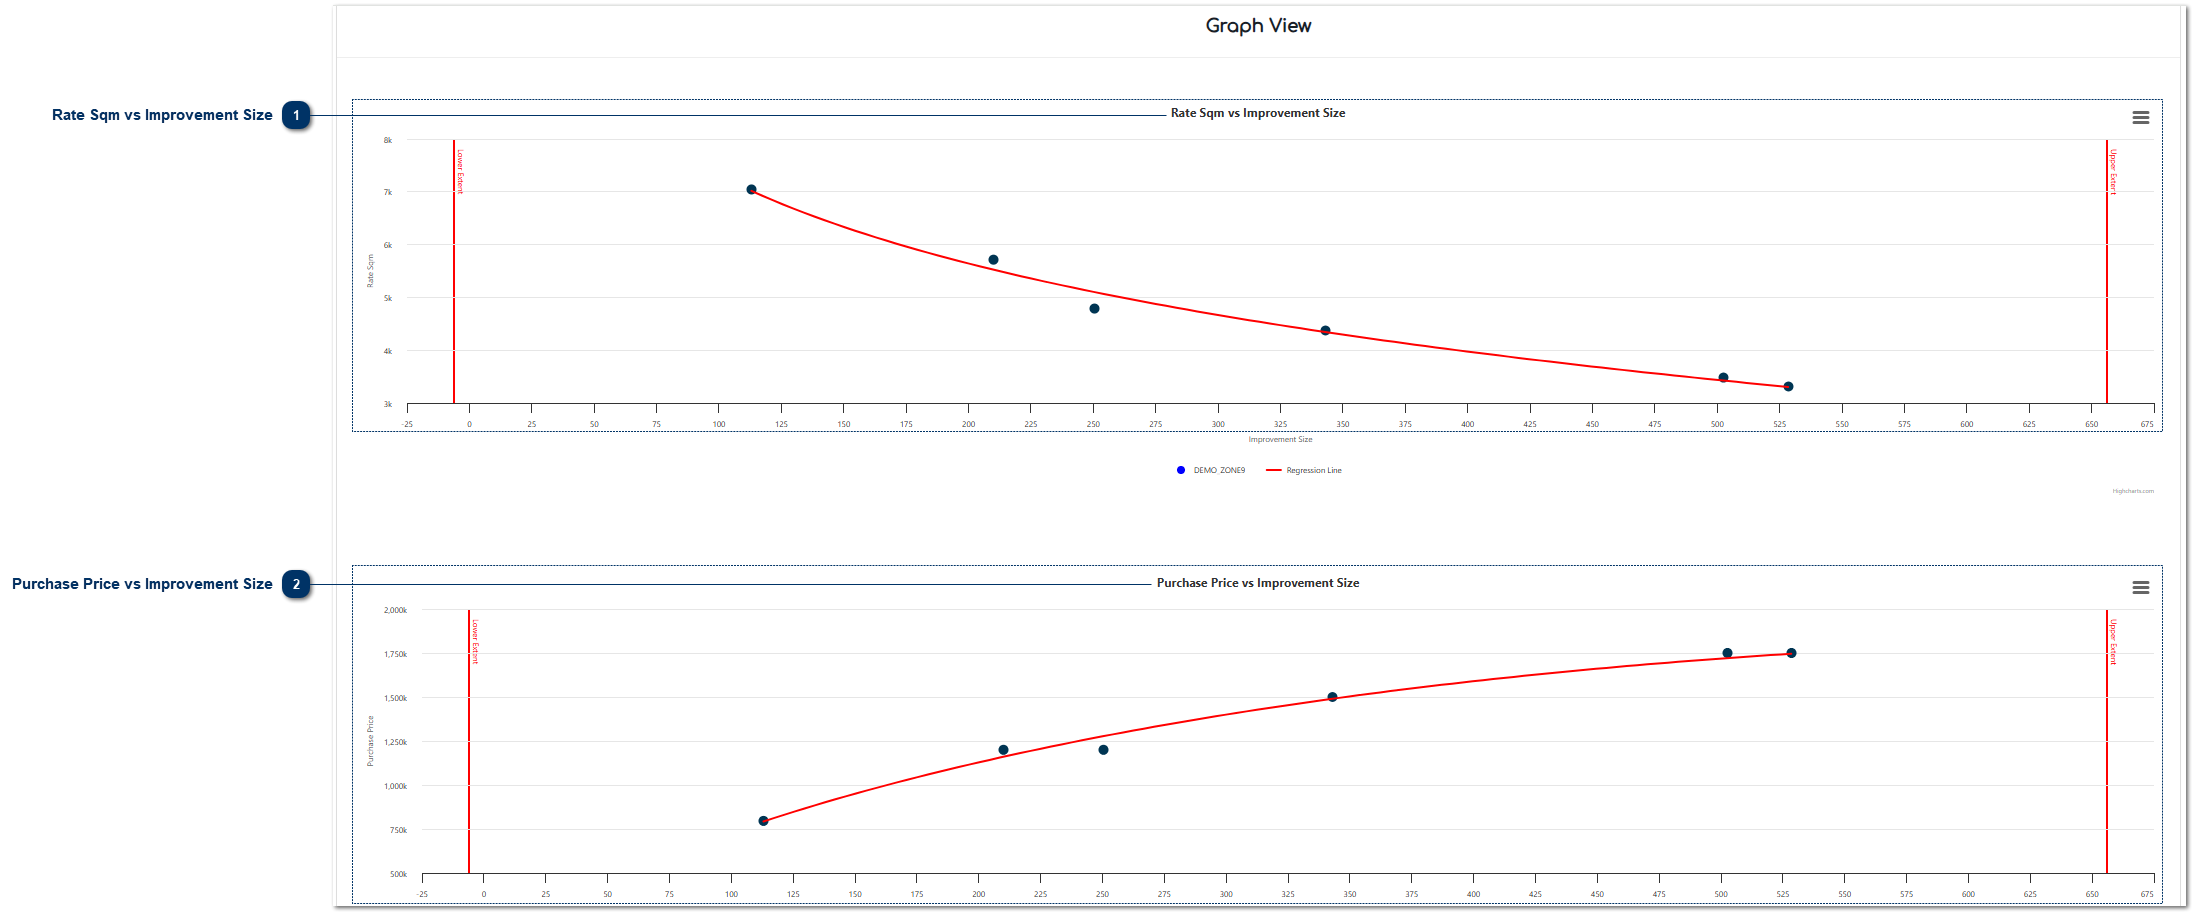
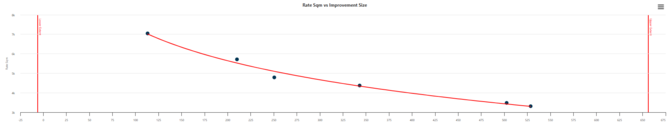
Rate Sqm vs Improvement Size The graph plots the correlation between the Improvement size and the calculated Rate per square meter.
|
|
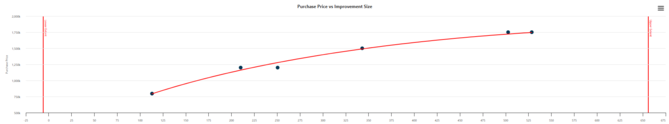
 Purchase Price vs Improvement Size The graph plots the correlation between the Improvement size and the calculated price of the property.
|
|